Hans Rosling, a Swedish professor of global health, was known for his TED Talks that revealed him to the public eye. He famously used moving bubbles on a chart to show development trends that surprised his audience. He passed away three years ago, after having inspired people in multiple fields, including data visualization. He is widely respected to this day, with his daughter-in-law and son, Ola Rosling and Hans Rosling, continuing his work at the Gapminder Foundation.
There is a 4-minute version of his presentation prepared in 2010 for the BBC that distills the essence of his methods and personality. Because it is included in my training material, I have probably seen it over 60 times. I notice something new each time and I have decided to share my observations. It’s probably best that you watch it first.
Pretty neat, eh? So, what did you notice? Here are my own observations.

0:04: “Visualization is right at the heart of my own work tools; I teach global health. And I know, having the data is not enough: I have to show it in ways people both enjoy and understand.”
In my training sessions, I usually stop the video after these first two sentences. As most of my audience members do not intend to become experts in data visualization, I like to point out for them how developing these skills is part of what made Rosling so influential. Perhaps they think that visualization is not a key skill for them, but what if it could be a differentiator for them as well?
The second sentence is about his philosophy ー being entertaining is part of being a good data communicator. This may seem obvious to an external audience, but the visualization community has debated for a long time whether the only way that a graph can be interesting is by being insightful.

0:18: “Now I’m going to try something I’ve never done before: animating the data in real space.”
While this video may look like typical Rosling, with the animated bubbles, it’s actually an experiment for him. The fact that he pulls it off so seamlessly is a testimony of his perfectionism and that of the BBC technical team.

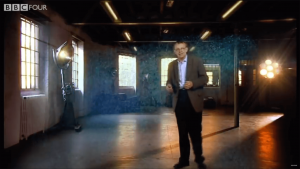
0:30
Who would have thought of putting such a high contrast background, with windows and lights behind such a sophisticated graph? Not to mention Rosling himself. Yet, we almost immediately forget about it and it just works, adding depth to the “real space” experiment.
Introducing the chart
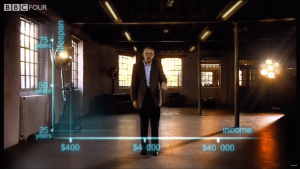
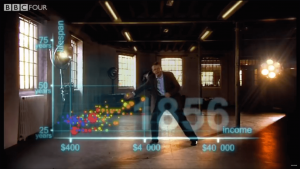
0:32: “First an axis for health, life expectancy, from 25 years to 75 years. And down here, an axis for wealth: income per person. 400, 4000 and 40 000 dollars.”
This graph is less simple than it looks. The vertical scale doesn’t start at zero and he uses a logarithmic scale for the horizontal axis. Both choices are correct, but making them look natural and obvious is a skill. I am not a fan of the vertical label (“lifespan”) however.
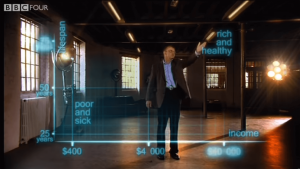
0:46: “Down here is poor and sick and up here is rich and healthy.”
Labelling the quadrants of a scatterplot is an excellent way to help the audience understand how it works. Rosling does this briefly at the beginning.
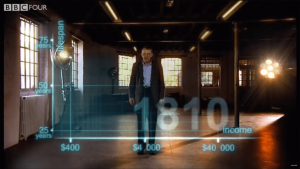
0:53: “Now I’m going to show you the world 200 years ago, in 1810.”
Time does not appear on the axis; it is shown through movement. As Rosling announces that the data starts in 1810, it appears in the lower right corner where no data will ever go, even as the points move.
Introducing the data
1:00: “Here come all the countries: Europe brown, Asia red, Middle East green, Africa South of Sahara blue, and the Americas yellow.
Here, Rosling makes the countries appear one region at a time, naming them and the associated colour. The “slow reveal” is also a matter of discussion in the visualization community: should we show everything at once, so that the audience can study at their own pace, or should we keep control of their attention by revealing parts of the graph one by one.
Also, why does Rosling call the orange bubbles “brown”? It’s a mystery to me.
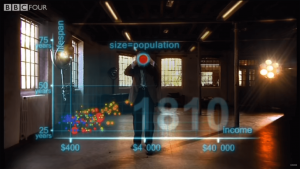
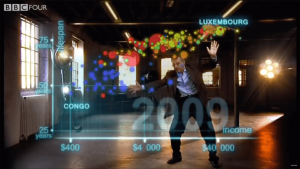
1:08: “And the size of the country bubble shows the size of the population.”
Rosling uses the scale of perceptions to add one more dimension: the size of the bubbles represents the population. The eye has difficulties measuring differences in area, so using it for a variable of lesser importance (population) adds a layer of data that can be perceived vaguely if necessary, like seeing that China and India are populous countries while Luxembourg and the Netherlands are not.
1:14: “And in 1810, it was pretty crowded down there, wasn’t it. All countries were sick and poor, life expectancy were below 40 in all countries.”
Rosling moves around a lot during his presentation. Not one to stand behind a podium, he goes to the data, he gets close to the visual. It becomes obvious for the audience where to focus their attention.
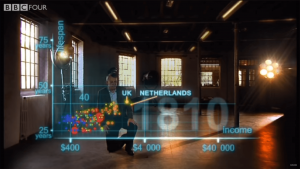
1:23: “Only UK and the Netherlands were slightly better off, but not much.”
This is the first instance of the temporary labelling of the countries, a method that is used systematically in the rest of the video. This comes in complement to Rosling mentioning them and looking at them. Once again, it tells the audience where to look and what they are looking at.
Narrating the trends
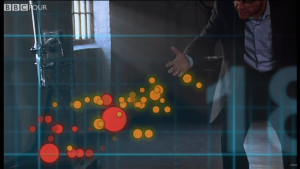
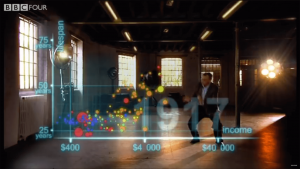
1:28: “And now, I start the world! The industrial revolution makes countries in Europe and elsewhere move away from the rest. But the colonized countries in Asia and Africa, they are stuck down there.”
“Colonized”. In one word, Rosling shows compassion and draws attention to what caused some of the countries to lag behind at the beginning of the industrial revolution.
Notice also his position. It’s dynamic. Rosling moves a lot.
1:43: “Eventually, the Western countries get healthier and healthier.”
His whole body movement reinforces what he’s saying. Here, he is lifting his arms and shoulders to convey that the richest countries are getting healthier, that is, moving up the vertical axis of life expectancy.
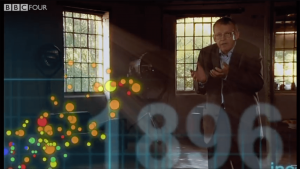
1:48: “And now we slow down to show the impact of the First World War and the Spanish flu epidemic. What a catastrophe!”
Many training participants laugh at this point, probably because of his inflexion and movement. Having had time to reflect on the significance of this “catastrophe”, the laughs make me a little uncomfortable, but I understand what provokes them.
Rosling slows down his animation to draw attention to quick movement that might be missed at full speed. This is animation’s version of zooming in.
His narration also reinforces what we should see in this flash: a catastrophe. Rosling does not shy away from editorial commentary.
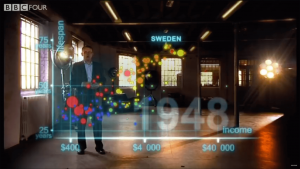
2:12: “After the tragedies of the second World War, we stop a bit to look at the world in 1948. 1948 was a great year. The war was over, Sweden topped the medal table at the winter Olympics, and I was born.”
Rosling uses humour and has good comedic timing, as we can tell from the slight modulation of his tone to say “…. and I was born”. It never fails to get a giggle from the training participants.
He stops his animation entirely and spends a good deal of time on a moment that he considers crucial because it sets the stage for something different that is about to happen. This is the end of an era.
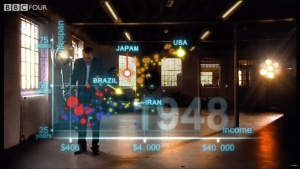
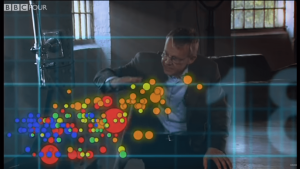
2:43: “But differences between the countries of the world was wider than ever. United States was in the front, Japan was catching up, Brazil was way behind, Iran was getting a little richer from oil but still had short lives and the Asian giants… China, India, Pakistan, Bangladesh and Indonesia, they were were still poor and sick down here.”
Here Rosling hesitates for a second before naming the “Asian giants”, starting with China. He has just gone through a long stretch of describing the state of the World in 1948 and had to memorize a lot (remember: he sees none of the bubbles) and speak flawlessly. Watching this video repeatedly, this short moment always appears like an eternity to me.
Notice also how the lines linking the labels are the same colour as the bubbles, but not the names, which remain light blue for all. I couldn’t quite explain this design choice, but it works.

2:50: “But look what is about to happen! Here we go again! In my lifetime…”
Rosling has said that he is inspired by sportscasters in his delivery and this is the beginning of the section where it shows the most, because he gets quite excited about the huge progress that countries are about to experience. He sets up his audience, telling them to anticipate something truly interesting. The little addition of “in my lifetime” adds to the idea that this all happened so fast.
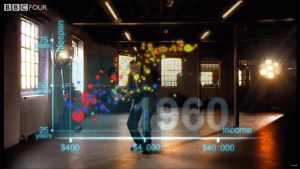
2:55: “… former colonies gained independence and then finally they started to get healthier and healthier and healthier!”
Once again, Rosling is linking the development of certain countries to decolonization, providing context and causes for the data.
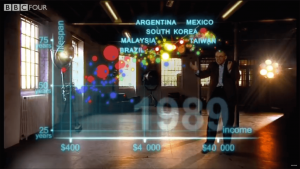
3:03: “And in the 1970s, then countries in Asia and Latin America started to catch up with the Western countries. They became the emerging economies.”
Again with the brief labelling of certain countries that support his point. There are a lot of them and it goes by fast, but you don’t really need to read every of them. Notice how Rosling doesn’t even mention them out loud.
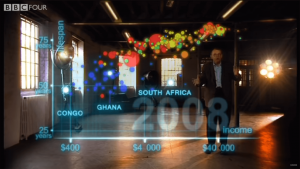
3:10: “Some in Africa follow. Some Africans were stuck in civil war and others hit by HIV.”
Another example where Rosling shows not only the trends, but also the causes of the data. He highlights war-torn Congo and HIV-stricken South Africa as he explains why they are outliers.
Explaining the current situation
3:15: “And now we can see the world today in the most up-to-date statistics. Most people today live in the middle. But there are huge differences at the same time between the best of countries and the worst of countries.”
This is the subject of another of his TED Talks: how the image of “rich and poor” countries is outdated because of how many people live in middle income countries. This seemed to be as important to him, as the fact that the world is on a positive path.
3:26: “And there are also huge inequalities within countries. These bubbles show country averages, but I can split them. Take China, I can split it into provinces.”
The animations change to allow him to explain in further details the current situation. He focuses on a single country, which is made brighter, while the others are faded out.
3:41 “There goes Shanghai. It has the same wealth and health as Italy today. And there is the poor inland province Guizhou. It is like Pakistan. And if I split it further, the rural parts are like Ghana in Africa.”
Just as spectacular as the moving bubbles is this animation that breaks down the countries into their regions, so as to show what the country averages are hiding. In this case, the development in certain areas of China varies between being comparable to Italy to comparable to Ghana. Notice as he extracts them as bubbles, not as pie slices, so that they remain comparable to the countries.
Delivering a conclusion and hinting at the future
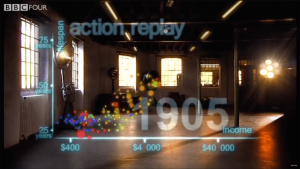
3:58 “And yet, despite the enormous disparities today, we have seen 200 years of remarkable progress. That huge historical gap between the West and the rest is now closing. We have become an entirely new converging world.”
After having taken the audience by the hand, stopped the animation, slowed it down and focused, Rosling gives them the full ride with an “action replay” going nonstop and fast through all 200 years. Knowing what to expect, they can now see the progress for themselves.
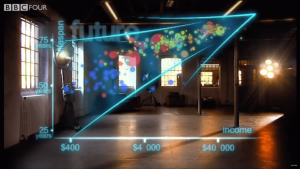
4:15 “And I see a clear trend into the future. With aid, trade, green technology and peace, it’s fully possible that everyone can make it to the healthy wealthy corner.”
Rosling has a message of hope. The data that he sees makes him believe in a world that will continue to develop and get healthier and he chooses to close his argument with this message. The arrow, using the gestalt principle of enclosure, reinforces this idea.
I like how he refers to the goal as “the healthy wealthy corner”. Visualizations are metaphors and they make us wish for certain visual outcomes, such as a longer bar, a darker green, an upward trend, just as much as we wish for the reality that it represents. At that moment, their abstractions are more real than the distant reality.
4:28
The dust effect is an elegant way of removing the visual, as Rosling comes back into the frame.

4:28: “What you’ve just seen in the last few minutes is a story of 200 countries shown over 200 years and beyond. It involved plotting one hundred and twenty thousand numbers. Pretty neat, eh?”
This touch of self-congratulatory humour at the end always works with my audiences. Most of the time, Rosling seems so intensely focused on conveying his findings that he rarely appears to be self-satisfied, so this slight departure is endearing.
Good design is ninety-nine percent invisible and much of what Hans Rosling does is the kind of work that seems natural, but is the result of considerable work, experience and clarity of purpose. The lesson here is that when there seems to be little to see, there is actually a lot to learn.
Francis Gagnon is an information designer and the founder of Voilà: (2013), a data visualization agency specialized in sustainable development.