
While organizing my colour tools, I thought of sharing a few of them here, some I’ve used, some new to me. The truth is that I intend to get better at it and it was prompted by a 2015 piece by Elijah Meeks that hit close to home:
“If you don’t feel capable of selecting a color scheme based on the fundamental principles of how humans perceive color, then what makes you think you can select between a hive plot and a Gannt Chart?”
So if that applies to you as well, I’ll start with five basic tools.
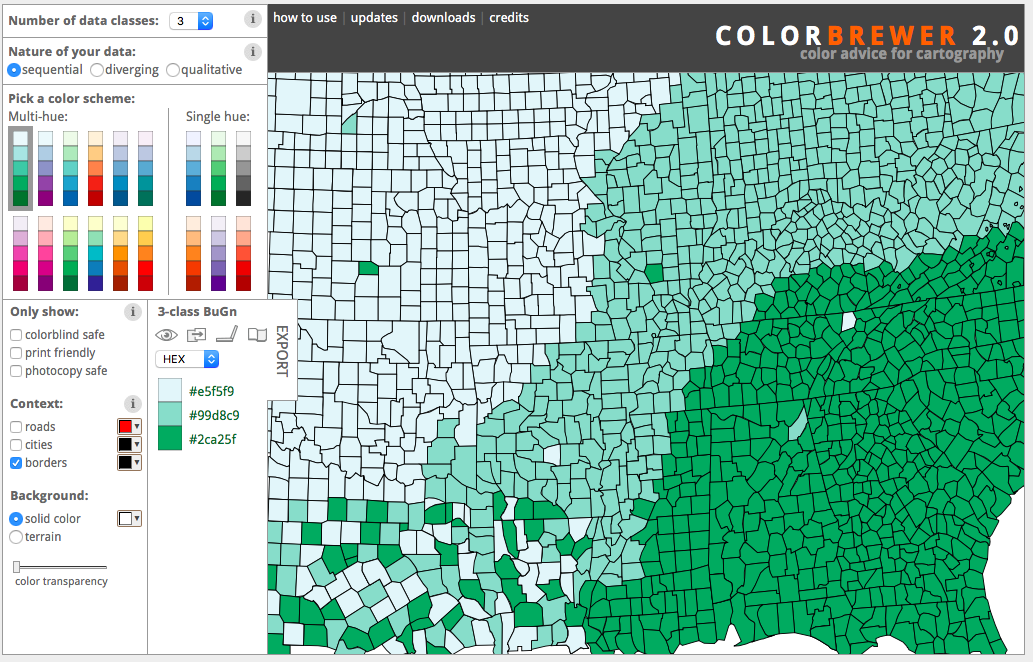
Color Brewer
The reference in colours for maps and more. It’s on every list. The interface is a bit dated by today’s standards, but it’s incredibly convenient, with options for colour-blind palettes, or even photocopy-safe ones. Why Cynthia Brewer has barely 1200 followers on Twitter is a mystery to me (well, she doesn’t tweet much).*
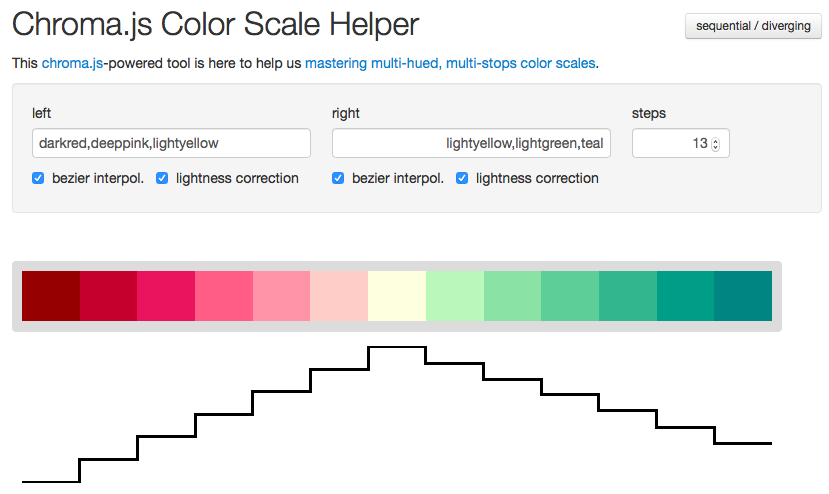
Chroma.js
Picking a colour scale with constant changes along the gradient is complicated by our non-linear perception of colours. The Color Brewer addresses this problem and Gregor Aisch takes it a step further by allowing us mere mortals to create our own properly-scaled multi-hue scale. It has quickly become an essential resource. It’s worth reading the thinking behind it and checking the color picker developed on top of it by Tristan Brown.
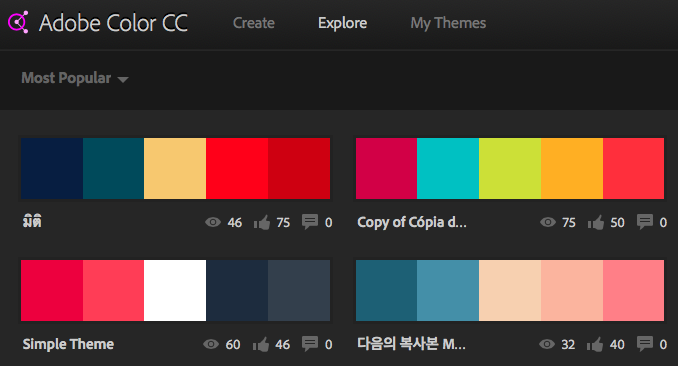
Adobe Color
Not everything in data visualization is about a perfect gradient or diverging palette. Many graphs require simply a pleasant palette. Looking at popular palettes from around the world can be inspiring.
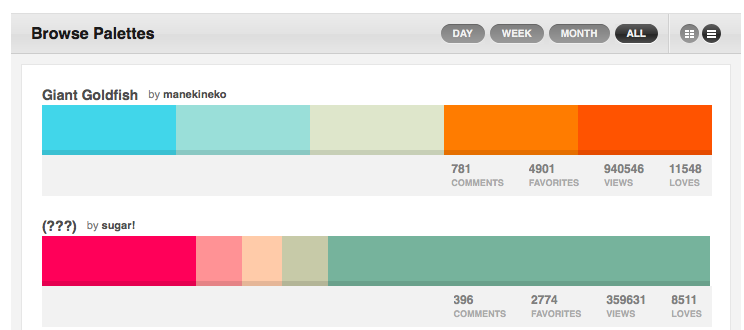
Colour Lovers
This tool acknowledges that a colour scheme has a main, a secondary and accent colours, unlike other tools that treat all colours in a palette as equal. Trigger alert: painful interface.
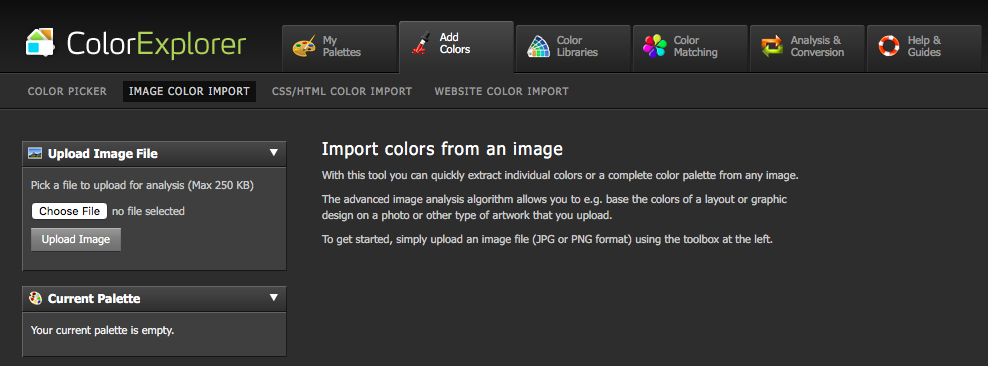
Color Explorer
This is a bit of a curve ball in the list. It extracts the colours from an image. Perfect for when you’re smitten by a picture and its palette (hello Wes Anderson).
There you go, with fewer excuses for using the default colour palette of your favorite dataviz tools.
*Because we Canadians pride ourselves on our humility yet brag about any famous Canadian, I’ll mention that Cynthia Brewer is Canadian. Also, Drake and the present use of the British spelling “colour”.
*In finding these resources, I’m indebted to Elijah Meeks, Nadiah Bremer, Lisa Charlotte Rost, and Andy Kirk.

Francis Gagnon is an information designer and the founder of Voilà: (2013), a data visualization agency specialized in sustainable development.


